larger largest
Time-ordered detector data were smoothed using the
same algorithm as described in the
Main Supplement, §V.G for SkyFlux.
This algorithm smoothed and resampled the IRAS detector data
from 16, 16, 8 and 4 samples per second at 12, 25, 60
and 100 µm, respectively, to two samples per second at
each wavelength. Additional information is found in Appendix B
of this Supplement.
Positional calculations were improved since the SkyFlux processing by the following corrections and modifications. Most important was the correction of an error that advanced the in-scan position by 115" for half the mission data. This error was found in the SkyFlux images and the ZOHF Version 2.0. No other data products were affected. A second improvement was in the data phasing. Phasing is the process by which the individual detector data streams are realigned with respect to each other to bring together samples taken at the same in-scan sky position. The satellite scan rate used for this process was changed from the initial scan rate of an observation to its average rate. A third improvement involved implementation of a new algorithm for the position computation. The cumulative effect of the position corrections and improved interpolation scheme is quantified for the ZOHF in Appendix H, Table H.4.
Although pointing reconstruction errors were a
relatively small contributor to the original position
errors, improvements in the satellite pointing reconstruction
made to support the IRAS Faint Source Survey were also
incorporated in the time-ordered detector data (Explanatory Supplement
to the IRAS Faint Source
Survey, §II.B). In general,
pointing reconstruction improvements reduced the in-scan
1-sigma boresight uncertainties from 3.0"
to 1.5" and the cross-scan
1-sigma from 4.5" to 3.0".
In addition, many scans that had
anomalously bad pointing were improved to bring them to the same
accuracy as the other scans.
|
|
|
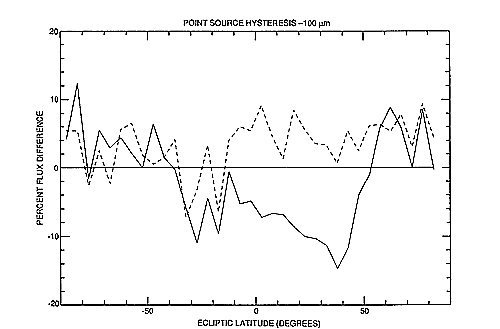
Figure III.A.1 Point Source Hysteresis Comparison - 100 µm.
This figure shows the 100 µm point source flux discrepancy
due to the hysteresis effect across the Galactic plane. A set of
100 µm point sources were selected along ecliptic longitude 270°.
Fluxes were measured and compared from ascending and descending scans and
the percent difference between the ascending and descending scans was computed.
The percent differences were averaged within a 5°× 10°
bin and plotted.
The Galactic plane crossing is around -15° ecliptic latitude. The
solid line represents the values from uncorrected scans and the broken
line represents the values from hysteresis-corrected scans. larger largest |
 R(t)
and is only applicable to the 60 and 100 µm detectors. For the 12 and
25 µm detectors the value of R(t) is zero.
The derived detector time constants are listed in
Tables III.A.2(a)-(d).
The improvement at 100 µm in tracking the point source responsivity
is seen in Figure III.A.1. This figure shows the average percent
difference within a 5°× 10° bin in
the point source fluxes as measured from ascending and descending
scans along ecliptic longitude 270°. At this longitude the
Galactic plane is crossed around -15° ecliptic latitude.
For this set of point sources,
the original uncorrected response function resulted in
the ascending scans overestimating the point source flux values
after the Galactic plane crossing by 10%-15%
compared to the descending scans (solid line).
The hysteresis-corrected
point source fluxes (broken line) show a reduced effect across the
Galactic plane. Discrepancies on the order of 6% RMS remain.
R(t)
and is only applicable to the 60 and 100 µm detectors. For the 12 and
25 µm detectors the value of R(t) is zero.
The derived detector time constants are listed in
Tables III.A.2(a)-(d).
The improvement at 100 µm in tracking the point source responsivity
is seen in Figure III.A.1. This figure shows the average percent
difference within a 5°× 10° bin in
the point source fluxes as measured from ascending and descending
scans along ecliptic longitude 270°. At this longitude the
Galactic plane is crossed around -15° ecliptic latitude.
For this set of point sources,
the original uncorrected response function resulted in
the ascending scans overestimating the point source flux values
after the Galactic plane crossing by 10%-15%
compared to the descending scans (solid line).
The hysteresis-corrected
point source fluxes (broken line) show a reduced effect across the
Galactic plane. Discrepancies on the order of 6% RMS remain.
R(t) = [A + B e- t/ B]/[1 - R(t)]
for T1 < t < T2 B]/[1 - R(t)]
for T1 < t < T2 |
| A = R(T1) - [ R(T1) * R(t)] - B*e-T1/B |
| B*e- t/B = e-(t - T1)/B/
[1 - e- (T2 - T1)/B]
* [(R(T1) - (R(T1) *R(T1))
- (R(T2) - (R(T2) *R(T2)))] |
| R(t) = min(R(t - )*e/p
+ K*Fint(t - ), Rmax) |
| K*Fint(t - ) = K* Fint(t - )
if Fint(t - ) >= Threshold |
| = 0 if Fint(t - ) < Threshold |
R = detector response due to photon exposure
B = bias boost time constant
p = photon exposure time constant
measured in
Joules
= delta time
| Detector # | Tau for Bias Boost (sec) |
|---|---|
| 23 | 1200 |
| 24 | 1200 |
| 25 | 1200 |
| 26 | 1200 |
| 27 | 1200 |
| 28 | 1200 |
| 29 | 1200 |
| 30 | 1200 |
| 47 | 1200 |
| 48 | 1200 |
| 49 | 1200 |
| 50 | 1200 |
| 51 | 1200 |
| 52 | 1200 |
| 53 | 1200 |
| 54 | 1200 |
| Mean Time Constant Standard Deviation | 1200 0 |
| Detector # | Tau for Bias Boost (sec) |
|---|---|
| 39 | 1200 |
| 40 | 1200 |
| 41 | 1300 |
| 42 | 1300 |
| 43 | 1700 |
| 44 | 1500 |
| 45 | 1500 |
| 46 | 1000 |
| 16 | 1000 |
| 17 | -- |
| 18 | 1200 |
| 19 | 1000 |
| 20 | -- |
| 21 | 1000 |
| 22 | 1200 |
| Mean Time Constant Standard Deviation | 1238 222 |
| Detector # | Tau for Bias Boost (sec) | Tau for Photon Exp. (sec) | Max. Effect (%) |
|---|---|---|---|
| 8 | 633 | 383 | 6 |
| 9 | 782 | 400 | 3 |
| 10 | 914 | 407 | 6 |
| 11 | 10000 | 476 | 6 |
| 12 | 10000 | 420 | 12 |
| 13 | 785 | 568 | 5 |
| 14 | 828 | 351 | 8 |
| 15 | 10000 | 250 | 8 |
| 31 | 10000 | 476 | 7 |
| 32 | 10000 | 439 | 10 |
| 33 | 10000 | 340 | 10 |
| 34 | 910 | 350 | 10 |
| 35 | 10000 | 626 | 5 |
| 36 | -- | -- | -- |
| 37 | 10000 | 430 | 13 |
| Mean Time Constant Standard Deviation | -- -- | 419 93 | 8 3 |
| Detector # | Tau for Bias Boost (sec) | Tau for Photon Exp. (sec) | Max. Effect (%) |
|---|---|---|---|
| 55 | 1200 | 1590 | 22 | 56 | 980 | 756 | 23 | 57 | 2200 | 1554 | 16 | 58 | 1400 | 1540 | 20 | 59 | 1200 | 1565 | 16 | 60 | 1200 | 1667 | 20 | 61 | 1600 | 1616 | 20 | 62 | 1450 | 1560 | 18 | 1 | 1320 | 1460 | 24 | 2 | 1490 | 1415 | 17 | 3 | 1600 | 1867 | 8 | 4 | 1100 | 1547 | 23 | 5 | 1415 | 1420 | 16 | 6 | 1000 | 704 | 13 | 7 | 1000 | 401 | 12 |
| Mean Time Constant Standard Deviation | 1344 316 | 1377 413 | 18 5 |
A sinusoidal variation added to a constant term was found to be a reasonable model for the TFPR brightness. The largest annual variation is due to the tilt of the symmetry plane of the zodiacal dust distribution with respect to the orbital plane of the Earth causing a variation in the line-of-sight path length through the dust cloud toward the north ecliptic pole. A secondary contribution is due to the eccentricity of the Earth's orbit that causes changes in the temperature and density of the interplanetary dust as the Earth's distance to the Sun changes. Some of the constant term in the TFPR model is due to the Galactic emission toward the north ecliptic pole.
To determine the constant term of the TFPR model, the brightness of the TFPR was measured between eight and ten times, depending on wavelength, during the IRAS mission using a special observation called the Total Flux CALibration, TFCAL. The TFCALs were based on the fact that two observations of the TFPR at different responsivities would yield both the absolute brightness of the TFPR and the zero point of the electronics. The change in the responsivities for the 12 µm detectors was achieved by use of the alternate bias level available to those detectors. For detectors at 25, 60 and 100 µm, the TFCAL observations made use of the responsivity enhancement caused by the heavy exposure of the detectors to the protons trapped in the South Atlantic Anomaly (SAA). Normally, a bias boost was applied during and immediately after SAA passages to anneal the detectors and return the responsivity to normal. For execution of the TFCALs, the bias boost annealing was delayed for a fraction of an orbit until the satellite could point to the TFPR. Two observations of the TFPR were made separated by the bias boost annealing cycle. Flashes of the internal stimulators during both TFPR observations calibrated the responsivity before and after the bias boost. Under the assumption that the electronic zero point remained unchanged by the bias boost, the brightness of the TFPR was extracted using this method. Responsivity variations of 300 to 400% were obtained at 60 and 100 µm, while variations of 30% were typical for 12 and 25 µm.
An important detail of the implementation of the TFCAL observations is the assumption that the bias boost did not alter the electronic zero point of the detectors. This was in fact an erroneous assumption. The bias boost did indeed change the electronic zero point of the detectors in most boosted modules due to heating of the cold electronics by the boosted bias current. This however was successfully modeled for removal in the TFCAL reduction process.
Independent information was obtained concerning the initial zero point for each detector from a single `chop' experiment performed during the first week of the IRAS mission. The cryogenically cooled cover which was still in place allowed zero background conditions for detectors at 12 and 25 µm. Measurements agreed with results from the TFCALs to within 6% and 10% at 12 and 25 µm. No measurements were obtainable at 60 and 100 µm because of uncertainties in the 60 and 100 µm background levels with the cover on (Main Supplement §VI.B.3.a).
In principle, the sinusoidal parameters of the TFPR model could be determined from the TFCAL measurements alone. However, the limited number of TFCALs were insufficient to yield an accurate phase and amplitude of the sinusoidal component. Instead, a measure of the annual variation was available in the form of differences between the north and south ecliptic pole brightnesses derived from about 200 IRAS survey scans. Each scan observed both poles within 50 minutes. The difference between the polar brightnesses removed drifts on time scales greater than 50 minutes. The annual variation in the brightness at the TFPR was then derived by fitting a sinusoid to the polar differences. The amplitude of the annual variation at the TFPR is then half the variation derived from the differences. This observationally determined the effect of the Earth's motion with respect to the symmetry surface of the zodiacal dust cloud. The polar difference had the undesirable effect of canceling out the TFPR brightness variations due to the eccentricity of the Earth's orbit. To account for the eccentricity of the Earth's orbit in the TFPR model, it was necessary to add back a model which represented this variation. When results of the TFCALs observations were combined with data extracted from survey scans connecting the north and south ecliptic poles, a smooth, sinusoidal variation in the TFPR brightness was apparent. Two significant changes were made in the TFPR model used to produce the ISSA and ZOHF Versions 3.0 and 3.1. Unlike the previous TFPR model, the current model includes the effect of the eccentricity in the Earth's orbit about the Sun as calculated from the zodiacal emission model of J. Good (Appendix G). The special calibration observations, the TFCAL observations, which determine the constant term of the TFPR model (also described in §VI.B.3 of the Main Supplement), were re-analyzed with noticeably improved results. The improved values for the TFPR model are found in Table III.A.3.
| Effective wavelength (µm) | 12 | 25 | 60 | 100 |
|---|---|---|---|---|
| Parameter:2 | ||||
| B0 (MJy/sr)3 | 12.5 | 23.3 | 8.1 | 9.6 |
| statistical uncertainty5 | 0.3 | 1.2 | 0.08 | 0.2 |
| total uncertainty6 | 1.6 | 3.1 | 0.47 | 1.3 |
| B1 (MJy/sr)3 | 1.73 | 2.66 | 0.67 | 0.19 |
| uncertainty7 | 0.1 | 0.1 | 0.1 | 0.05 |
| phi (day)4 | -38.3 | -32.8 | -34 | -31 |
| uncertainty7 | 1.6 | 1.5 | 8 | 9 |
The internal consistency of the TFCAL observations is now 2% or better
of the
TFPR brightness at 12, 60 and 100 µm and 5% at
25 µm. The zero point uncertainties in the TFPR model based upon
internal inconsistencies are now 0.36, 1.2, 0.17, and 0.4 MJy
sr-1,
at 12, 25, 60 and 100 µm, respectively. The uncertainties
in the basic responsivity calibration of the IRAS data traced
back to standard stars and the asteroid model remains 2%, 5%,
5% and 10% at 12, 25, 60 and 100 µm, as discussed in
§VI.C.2.c
on page VI-24 of the Main Supplement. The actual
zero point uncertainties of the survey observations are
larger than those of the TFPR model due to baseline drifts on
time scales shorter than one day, variation of the sky position
observed as the TFPR (§II.B.4) and other systematic effects
discussed in §IV.