|
|
MAXIMA Images Click on thumbnails for larger images Feel free to copy images with credit to "The MAXIMA Collaboration" Click here for data-related images Click here for instrument and balloon-related images |
|
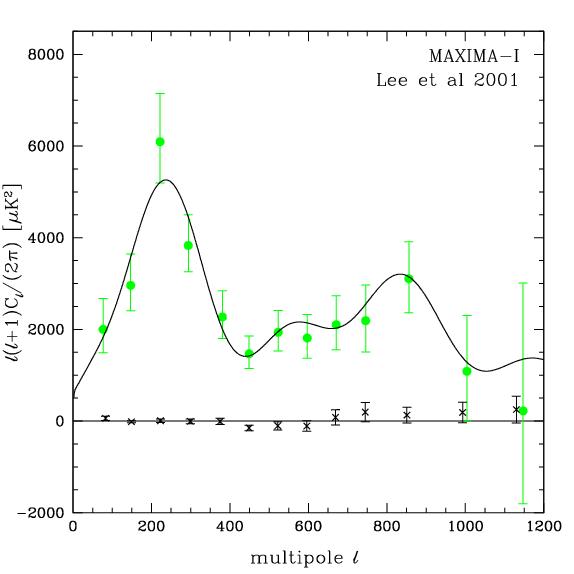
This power spectrum presents the most recent
temperature anisotropy results from MAXIMA, as reported in (Lee et
al 2001). The measured power spectrum points are shown with green
solid circles and 1 sigma error bars, overlayed on a best-fit spectrum
over all multipoles (solid black line). The power spectrum of the map
created by the difference of two 150 GHz detectors are shown with
black 'x' and 1 sigma error bars. Click here to see .eps, .jpg
|
|
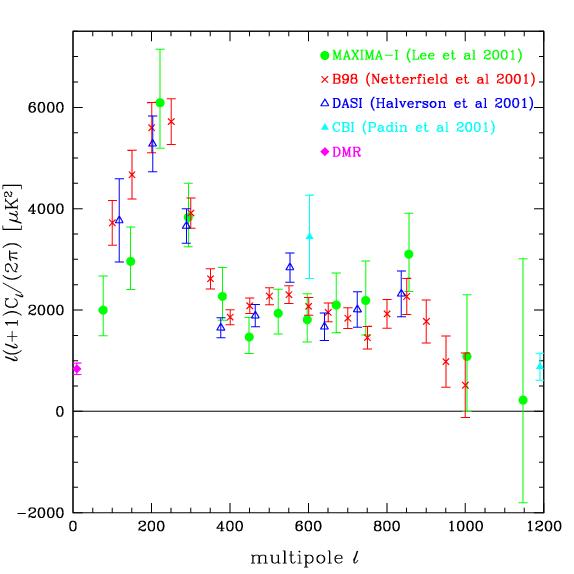
This power spectrum presents the most recent
temperature anisotropy results from MAXIMA (Lee et al 2001),
BOOMERanG (Netterfield et all 2001), DASI (Halverson et al
2001), CBI (Padin et al 2001), and COBE-DMR, as of Nov
2001. All points are shown with 1 sigma error bars. Click here to
see .eps, .jpg
|
|
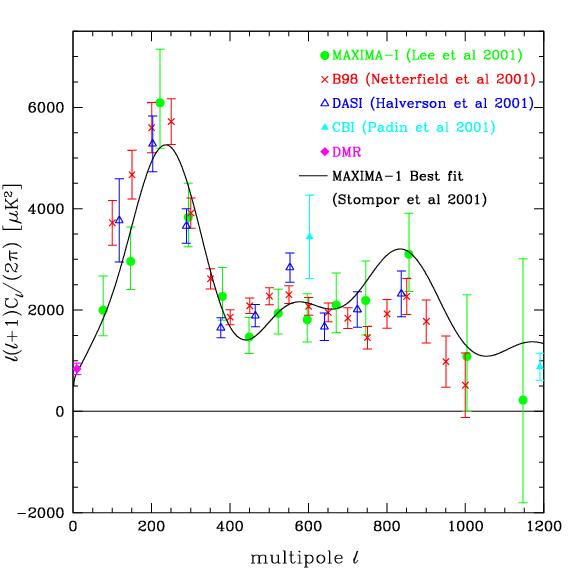
This power spectrum presents the most recent
temperature anisotropy results from MAXIMA (Lee et al 2001),
BOOMERanG (Netterfield et all 2001), DASI (Halverson et al
2001), CBI (Padin et al 2001), and COBE-DMR,as of Nov
2001. All points are shown with 1 sigma error bars, and are
overlayed on the best-fit MAXIMA-1 spectrum (Stompor et al 2001).
Click here to see .eps, .jpg
|
|
Map of CMB anisotropy with 10' resolution from
MAXIMA-1. The map is made using data from three 150 GHz and one 240
GHz photometers and contains 15,000 pixels of 5' by 5'. This map is
weiner filtered to smooth out pixel-scale noise. The completely unfiltered map shows the same structures.
|
|
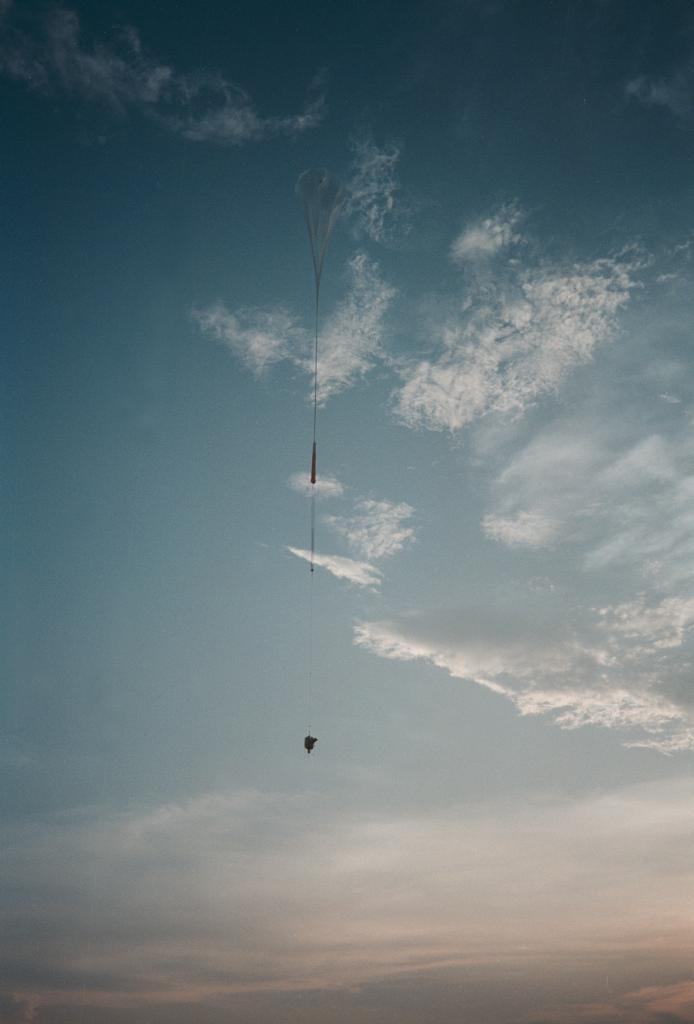
A successful launch of the MAXIMA payload!
|
|
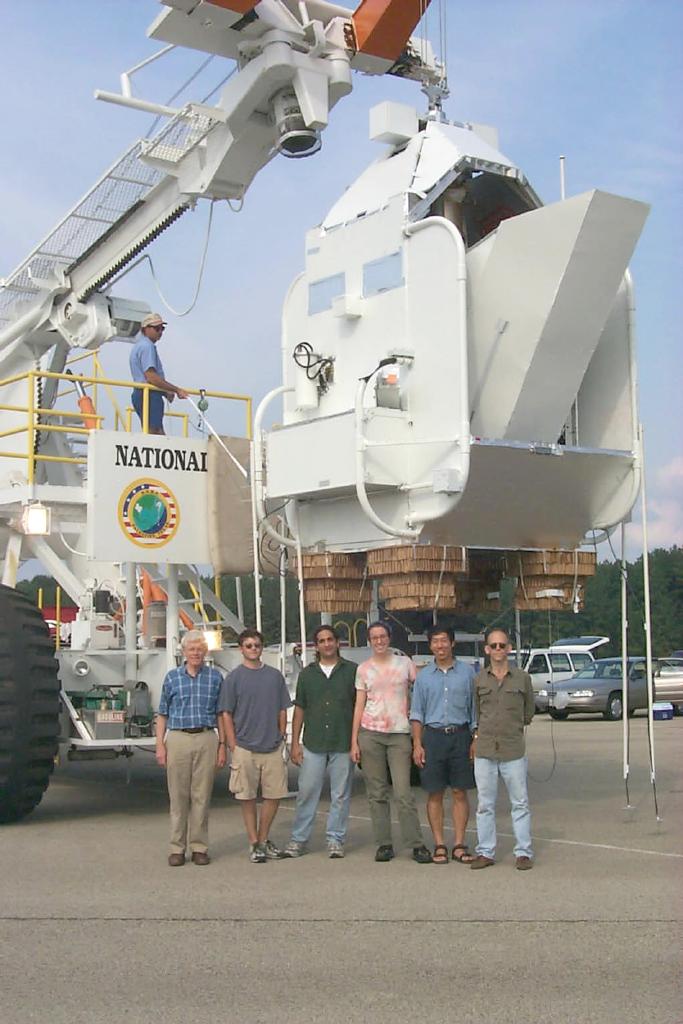
MAXIMA experimentalists posing before the June 15, 1999 launch.
|
|
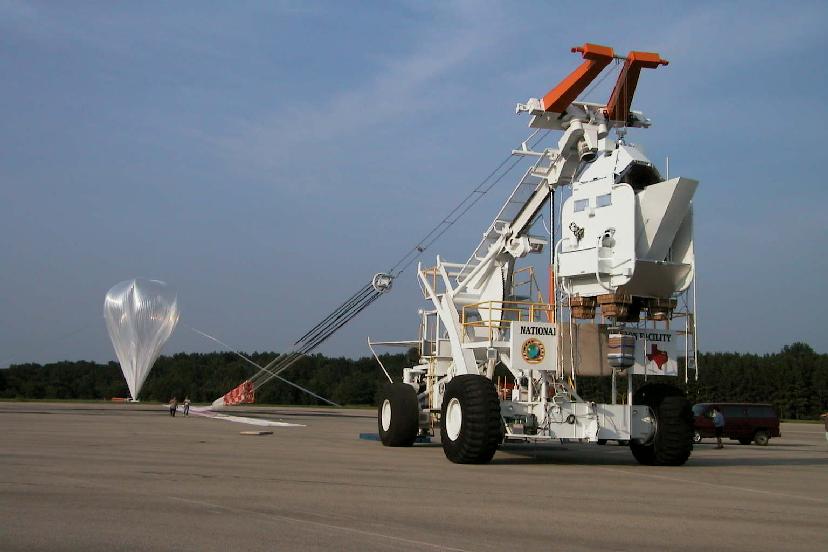
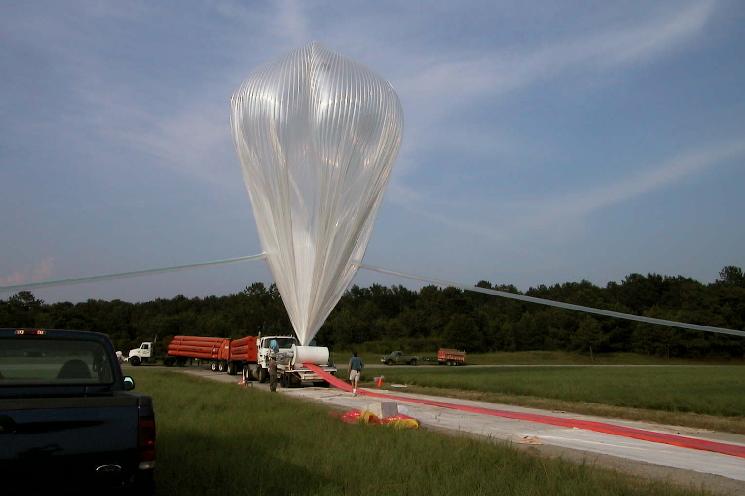
MAXIMA 2 payload on "Tiny Tim", the launch vehicle, and inflating balloon: June
15, 1999
|
|
View of Inflating balloon: MAXIMA 2; June
15, 1999
|
|
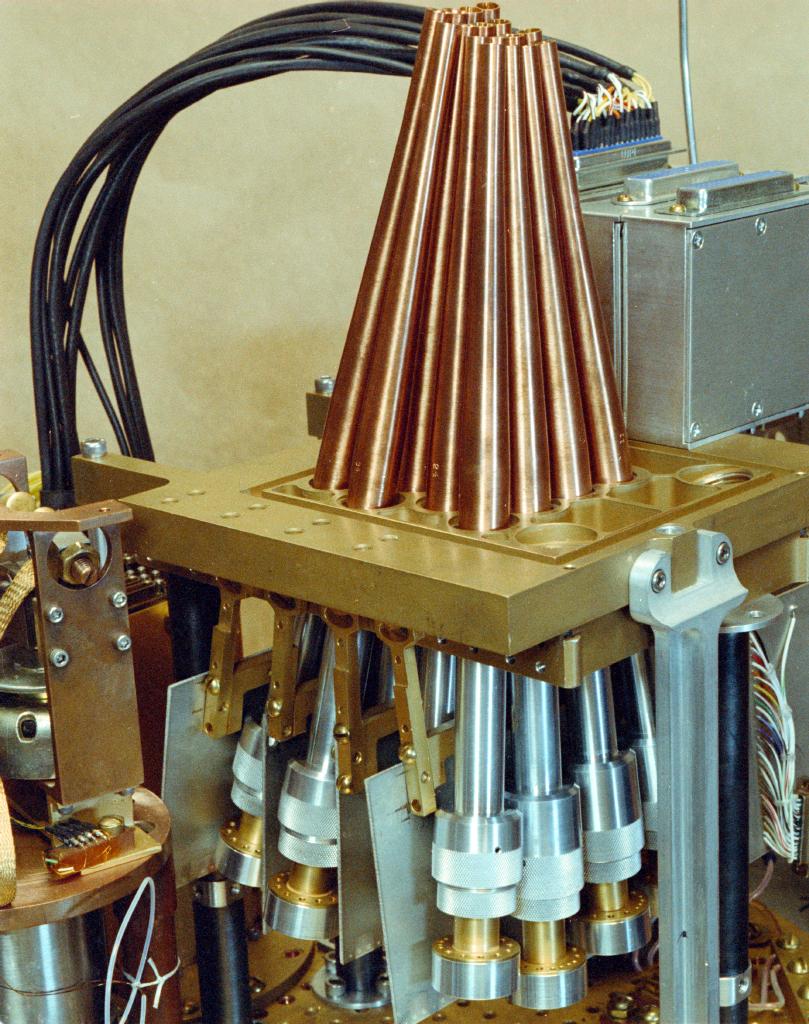
The inside of the receiver. Much of the
paneling has been removed to give a clear view. Visible are the horns
which channel light to the detectors, which are housed in the circular
'caps' near the bottom of this image. The small boxes in back are the
cryogenic preamplifiers.
|
|
Wireframe schematic of the MAXIMA Telescope
|
|
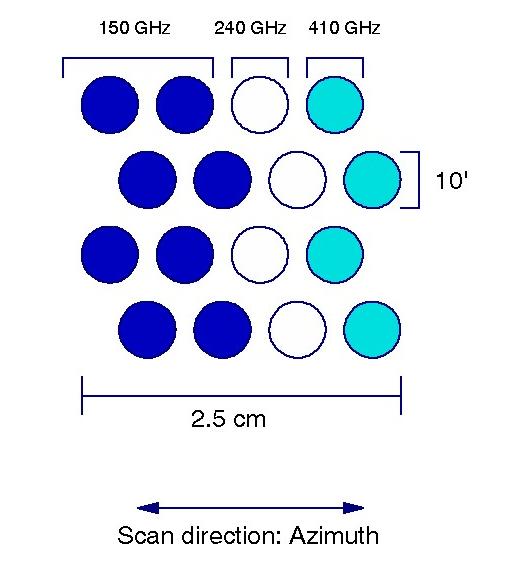
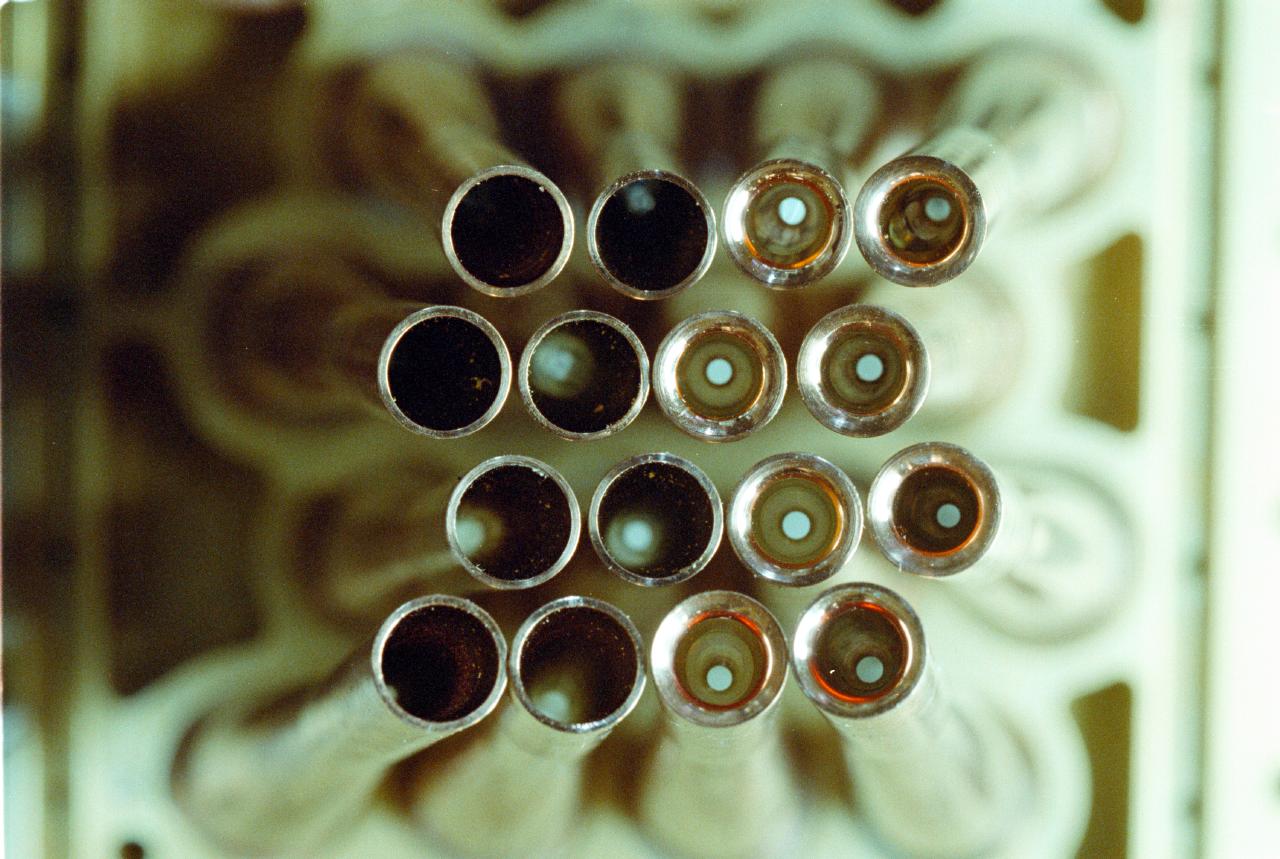
The 16 element focal plane schematic. MAXIMA uses 16
detectors, operating at 3 different optical frequencies to measure the
Cosmic Microwave background.
|
|
The physical focal plane. These copper feed horns
channel the focused light to the actual detectors
|