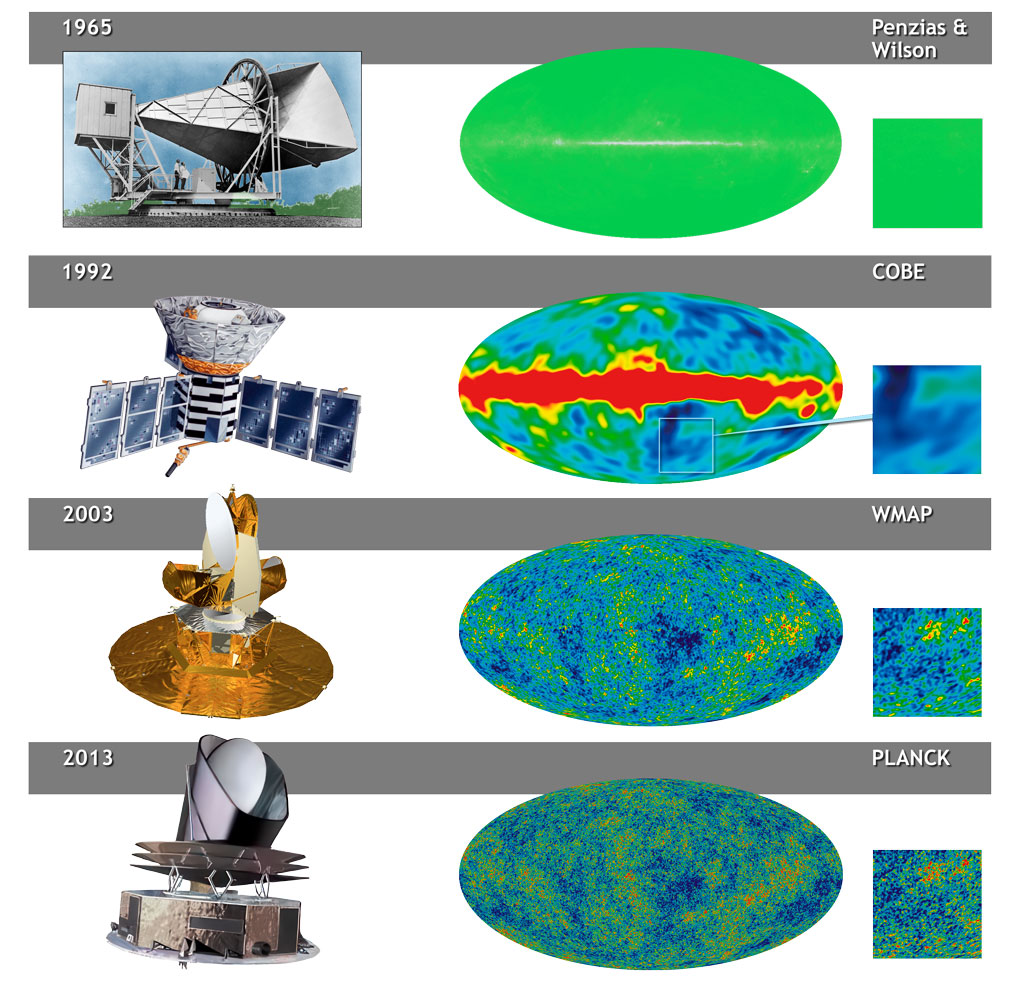
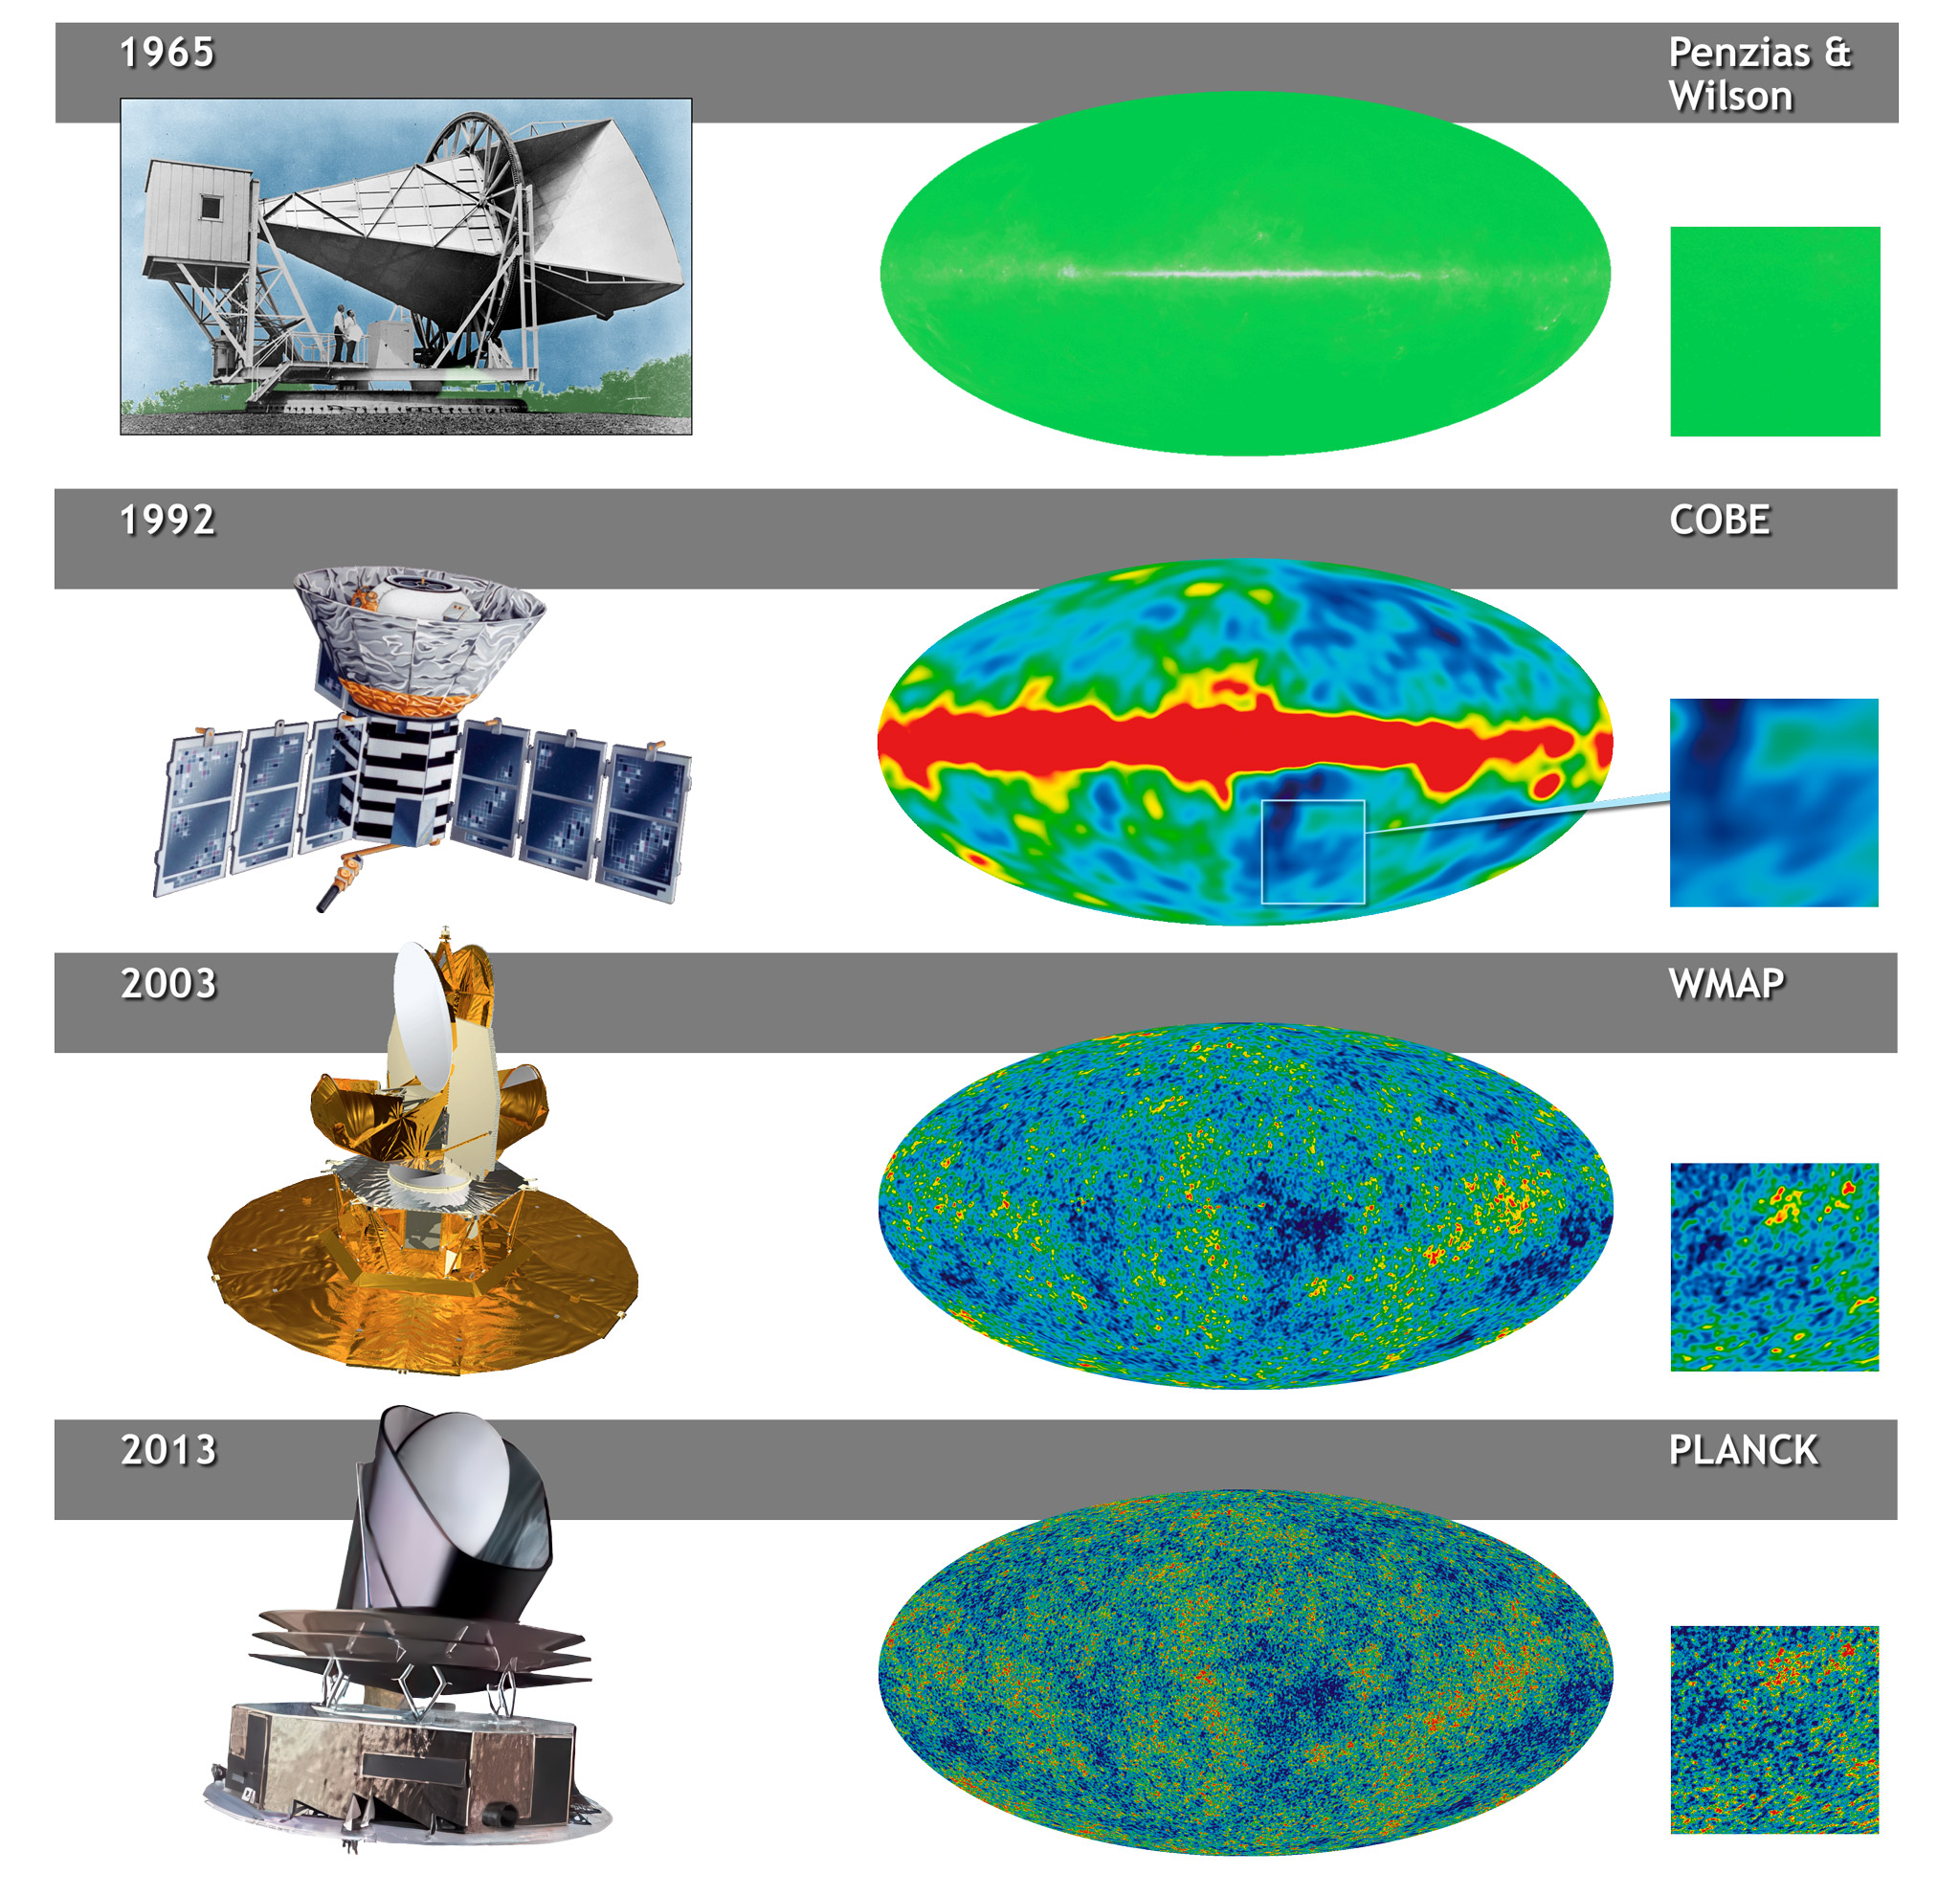
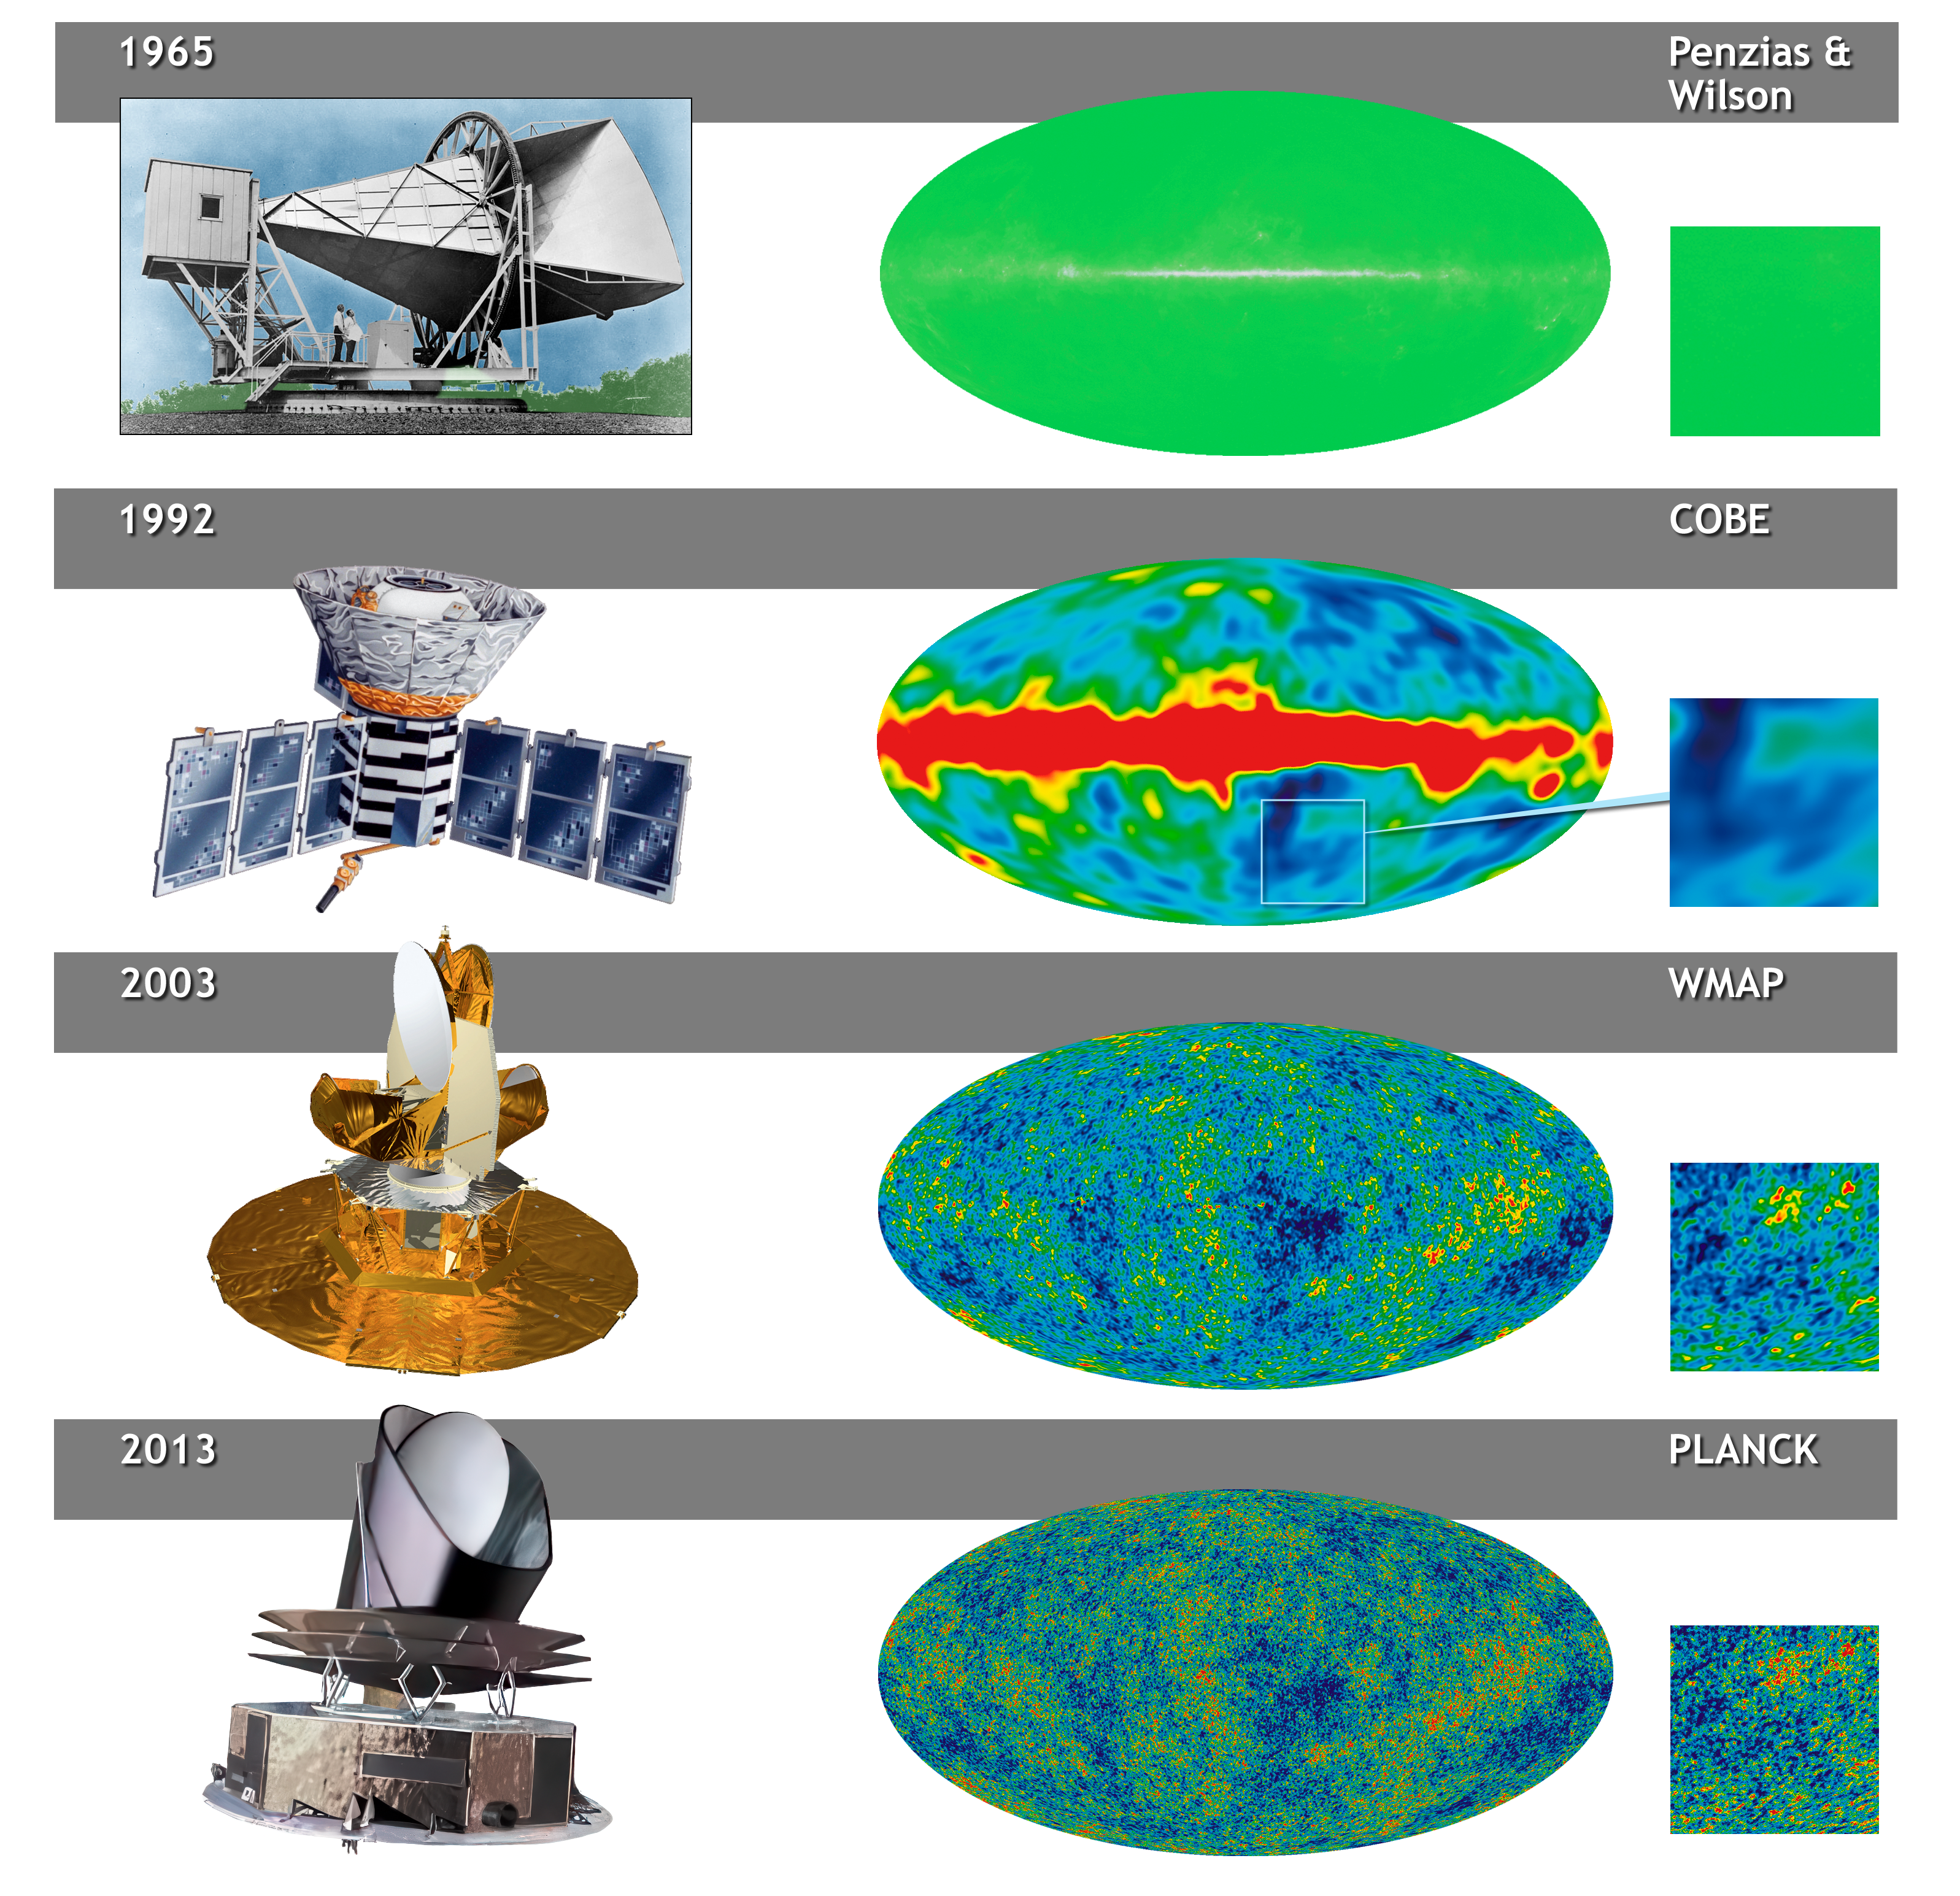
IMAGES: CMB Discovery HistoryMajor milestones in the study of the Cosmic Microwave Background radiation are depicted in this updated graphic (2024-10-10).
DescriptionsPenzias & Wilson
Observational Epoch: 1964 - 1965 CMB Image Description: A simulation of the entire sky as might have been seen if the pioneering radio observations had not been limited to ground-based zenith pointings. The majority of the temperature map (in green) is dominated by the isotropic 2.7 K blackbody emission from the CMB. Only along the plane of the Milky Way does Galactic emission (pink) exceed that of the CMB by a few degrees Kelvin. (NASA/WMAP Science Team) COBE/DMR
Observational Epoch: 1989 - 1993 CMB Image Description: DMR map of the full sky at 53 GHz, obtained after four years of observations. The DMR instrument was designed to map small deviations (colder/hotter) from the isotropic 2.7 K blackbody radiation discovered by Penzias and Wilson (note the temperature scale is ± 200 µK, in comparison to the Kelvin scales in the Penzias and Wilson image). The map shows both these CMB temperature fluctuations (blue and green) and Galactic emission (red) components at an angular resolution of 10 degrees. Later experiments would be able to separate the Galactic and CMB components more cleanly. (NASA/COBE DMR Science Team) WMAP
Observational Epoch: 2001 - 2010 CMB Image Description: WMAP nine-year full sky image of the CMB fluctuations (anisotropies) at an angular resolution of 1 degree. A linear combination of all five WMAP frequencies was used to remove much of the Galactic foreground emission. The temperature scale is ± 200 µK. (NASA/WMAP Science Team) Planck
Observational Epoch: 2009 - 2013 CMB Image Description: Planck full mission all-sky image of the CMB fluctuations at an angular resolution of a few arcminutes. Additional frequencies and higher resolution detectors added information about the CMB anisotropies on smaller angular scales and allowed more fidelity in removal of Galactic dust emission. The temperature scale is ± 200 µK. (NASA/Lambda Team, render from Planck Data) |