Hubble constant values have been given in the literature for seven clusters of
galaxies with redshifts from 0.023 to 0.182: Abell 1656 (Herbig et al. (1995));
Abell 2256, 478, and 2142 (Myers et al. (1997)); Abell 2163 (Holzapfel et al. (1997)); Abell 2218
(McHardy et al. (1990), Birkinshaw & Hughes (1994), Jones (1995)); and Abell 665 (Birkinshaw et al. (1991)). With the addition of
CL 0016+16 at redshift 0.546, the resulting Hubble diagram (Figure 2)
covers a wide range of redshifts. Although the accuracy of the individual
measurements is low, we can use the diagram to reach a best-guess value for
 of
of  , with an error of about
  if the errors on the individual measurements are
independent. No useful constraints can be placed on
if the errors on the individual measurements are
independent. No useful constraints can be placed on  based on these data.
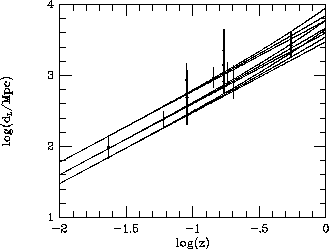
Figure 2: The
Hubble diagram based on
distances derived using the Sunyaev-Zel'dovich effect and X-ray
data. Lines show the theoretical curves for  and
and  . Three
independent determinations of the distance are shown for Abell 2218
(which lies at redshift 0.171).
. Three
independent determinations of the distance are shown for Abell 2218
(which lies at redshift 0.171).
However this error on  is unreliable, since the points on the curve are
not fully independent. The random elements of the errors in the distance scale
are (presumably) independent from cluster to cluster, but the distances rely on
good knowledge of the three-dimensional shapes of the clusters and on
well-calibrated flux and brightness temperature scales for the X-ray and SZ
effects respectively.
is unreliable, since the points on the curve are
not fully independent. The random elements of the errors in the distance scale
are (presumably) independent from cluster to cluster, but the distances rely on
good knowledge of the three-dimensional shapes of the clusters and on
well-calibrated flux and brightness temperature scales for the X-ray and SZ
effects respectively.
The three-dimensional structure leads to an orientation-dependent error in the
distance scale: it is easier to measure the X-ray emission and SZ effects from
clusters with long axes lying down the line of sight (Birkinshaw et al. (1991)). This can
introduce an error if the selection criteria for the clusters in the Hubble
diagram are not orientation-independent: for some of the clusters used here
this is not the case -- CL 0016+16, for example, was selected on the basis of
optical imaging which, like the X-ray surveys, is better at finding clusters
which are elongated on the line of sight or superpositions of clusters. Other
model-dependent errors in the estimate for  are likely to be less
important, and are discussed in Birkinshaw (1997).
are likely to be less
important, and are discussed in Birkinshaw (1997).
The X-ray flux scale of ROSAT is critical in these measurements, and this is presumably uncertain by 5 per cent or so, which will introduce a systematic 5 per cent error in all the distances. For the SZ effects, errors at the 5 per cent level in the brightness temperature scale are also possible: this will introduce a systematic 10 per cent error into all distance measurements made by a particular instrument. There is therefore some freedom at the level of 10 per cent or so to move the measurements of sets of clusters made by particular groups up or down on Figure 2, and the freedom to move the entire set which use ROSAT data up or down by about 5 per cent. It is thought that calibration errors in the X-ray spectroscopy are less important.