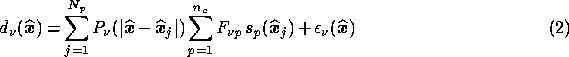
As a first step in discussing component separation methods, let us consider in
more detail how the simulated data are made. At any given frequency  the
total rms temperature fluctuation on the sky in a direction
the
total rms temperature fluctuation on the sky in a direction  is
given by the superposition of
is
given by the superposition of  physical components (
 in our
simulations). It is convenient to factorise the contribution of each process
into a spatial template
in our
simulations). It is convenient to factorise the contribution of each process
into a spatial template  at a reference frequency
  and a
frequency dependence
and a
frequency dependence  , so that
In this paper we take the reference frequency  and normalise the
frequency dependencies such that
and normalise the
frequency dependencies such that  .
.
If we observe the sky at  observing frequencies then, in any given
direction
observing frequencies then, in any given
direction  , we obtain a
  -component data vector that
contains the observed temperature fluctuation in this direction at each
observing frequency plus instrumental noise. In order to relate this data
vector to the emission from each physical component it is useful to introduce
the
-component data vector that
contains the observed temperature fluctuation in this direction at each
observing frequency plus instrumental noise. In order to relate this data
vector to the emission from each physical component it is useful to introduce
the  frequency response matrix with components defined by
where  is the frequency response (or transmission) of the
  th
frequency channel. Assuming that the satellite observing beam in each channel
is spatially invariant, we may write the beam-smoothing as a convolution and,
in discretised form, the
th
frequency channel. Assuming that the satellite observing beam in each channel
is spatially invariant, we may write the beam-smoothing as a convolution and,
in discretised form, the  th component of the data vector in the direction
 is then given by
where  is the beam profile for the
  th frequency channel,
and the index
th frequency channel,
and the index  labels the
  pixels in each of the simulated input maps;
the
pixels in each of the simulated input maps;
the  term represents the instrumental noise in the
 th channel in the direction
  .
.
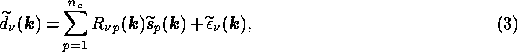
In each channel the beam profile is assumed spatially invariant and the noise statistically homogeneous (which are both reasonable assumptions for small fields), and it is more convenient to work in Fourier space, since the convolution in (2) becomes a simple multiplication and we obtain
where  are the
components of the response matrix for the observations. It is important
to note that (3) is satisfied at each Fourier mode
are the
components of the response matrix for the observations. It is important
to note that (3) is satisfied at each Fourier mode  independently. Thus, in matrix notation, at each mode we have
where  ,
,  and
and  are column vectors
containing
are column vectors
containing  ,
,  and
and  complex components respectively, and the
response matrix
complex components respectively, and the
response matrix  and has dimensions
  . Although the
column vectors in (4) refer to quantities defined in the Fourier
domain, it should be noted that for later convenience they are not written with
a tilde.
. Although the
column vectors in (4) refer to quantities defined in the Fourier
domain, it should be noted that for later convenience they are not written with
a tilde.
The significant simplification that results from working in the Fourier domain
is clear, since the dimensions of the matrices in (4) are rather
small ( and
and  in our simulations). Thus, the situation reduces to
the solving a small-scale linear inversion problem at each Fourier mode
separately. Once this inversion has been performed for all the measured modes,
the spatial templates for the sky emission due to each physical component at
the reference frequency
in our simulations). Thus, the situation reduces to
the solving a small-scale linear inversion problem at each Fourier mode
separately. Once this inversion has been performed for all the measured modes,
the spatial templates for the sky emission due to each physical component at
the reference frequency  are then obtained by an inverse Fourier
transformation. Due to the presence of instrumental noise, however, it is clear
that the inverse,
are then obtained by an inverse Fourier
transformation. Due to the presence of instrumental noise, however, it is clear
that the inverse,  , of the response matrix at each Fourier
mode does not exist and that the linear inversion problem in each case is
degenerate. The approximate inversion of (4) must therefore be
performed using a statistical technique in which the inversion is regularised
in some way. This naturally leads us to consider a Bayesian approach.
, of the response matrix at each Fourier
mode does not exist and that the linear inversion problem in each case is
degenerate. The approximate inversion of (4) must therefore be
performed using a statistical technique in which the inversion is regularised
in some way. This naturally leads us to consider a Bayesian approach.
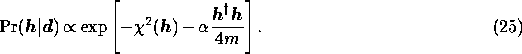
Bayes' theorem states that, given a hypothesis  and some data
  the
posterior probability
the
posterior probability  is the product of the likelihood
  and the prior probability
  , normalised by the evidence
  ,
,
In our application, we consider each Fourier mode  separately and,
from (4), we see that the data consist of the
separately and,
from (4), we see that the data consist of the  complex numbers
in the data vector
complex numbers
in the data vector  , and we take the `hypothesis' to consist of
the
, and we take the `hypothesis' to consist of
the  complex numbers in the signal vector
  . We then choose
as our estimator
. We then choose
as our estimator  of the signal vector that which
maximises the posterior probability
of the signal vector that which
maximises the posterior probability  . Since the
evidence in Bayes' theorem is merely a normalisation constant we must therefore
maximise with respect to
. Since the
evidence in Bayes' theorem is merely a normalisation constant we must therefore
maximise with respect to  the quantity
which is the product of the likelihood  and the
prior
and the
prior  .
.
Let us first consider the form of the likelihood. If the instrumental noise on
each frequency channel is Gaussian-distributed, then at each Fourier mode the
probability distribution of the  -component noise vector
  is described by an
  -dimensional multivariate Gaussian. Assuming the
expectation value of the noise to be zero at each observing frequency, the
likelihood is therefore given by
-dimensional multivariate Gaussian. Assuming the
expectation value of the noise to be zero at each observing frequency, the
likelihood is therefore given by
where the dagger denotes the Hermitian conjugate and in the second line we have
used (4). We note that no factor of  appears in the exponent
in (6) since it refers to the multivariate Gaussian distribution of
a set of complex random variables. The noise covariance matrix
appears in the exponent
in (6) since it refers to the multivariate Gaussian distribution of
a set of complex random variables. The noise covariance matrix
 has dimensions
  and at any given Fourier mode
 it is defined by
i.e. its elements are given by  , where the asterisk denotes
complex conjugation. Thus, at a given Fourier mode, the
, where the asterisk denotes
complex conjugation. Thus, at a given Fourier mode, the  th diagonal
element of
th diagonal
element of  contains the value at that mode of the
ensemble-averaged power spectra of the instrumental noise on the
contains the value at that mode of the
ensemble-averaged power spectra of the instrumental noise on the  th
frequency channel. If the noise is uncorrelated between channels then the
off-diagonal elements are zero for all
th
frequency channel. If the noise is uncorrelated between channels then the
off-diagonal elements are zero for all  .
.
We note that the expression in square brackets in (6) is simply the
 misfit statistic. Since, for a given set of observations, the data
vector
misfit statistic. Since, for a given set of observations, the data
vector  , the response matrix
  and the noise
covariance matrix
and the noise
covariance matrix  are all fixed, we may consider the misfit
statistic as a function only of the signal vector
are all fixed, we may consider the misfit
statistic as a function only of the signal vector  ,
,
so that the likelihood can be written as
Having calculated the form of the likelihood we must now turn our attention to
the form of the prior probability  .
.
If we assume that the emission due to each of the physical components is well
approximated by a Gaussian random field, then it is straightforward to derive
an appropriate form for the prior  . In this case, the
probability distribution of the sky emission is described by a multivariate
Gaussian distribution, characterised by a given sky covariance matrix. Thus, at
each mode
. In this case, the
probability distribution of the sky emission is described by a multivariate
Gaussian distribution, characterised by a given sky covariance matrix. Thus, at
each mode  in Fourier space, the probability distribution of the
signal vector
in Fourier space, the probability distribution of the
signal vector  is also described by a multivariate Gaussian of
dimension
is also described by a multivariate Gaussian of
dimension  , where
  is the number of distinct physical components
(
is the number of distinct physical components
( in our simulations). The prior therefore has the form
where the signal covariance matrix  is real with dimensions
  and is given by
i.e. it has elements  . Thus, at each Fourier mode, the
 th diagonal element of
  contains the value of the
ensemble-averaged power spectrum of the
contains the value of the
ensemble-averaged power spectrum of the  th physical component at the
reference frequency
th physical component at the
reference frequency  ; the off-diagonal terms describe cross-power
spectra between the components.
; the off-diagonal terms describe cross-power
spectra between the components.
Strictly speaking, the use of this prior requires advance knowledge of the full
covariance structure of the processes that we are trying to reconstruct.
Nevertheless, it is anticipated that some information concerning the power
spectra of the various components, and correlations between them, will be
available either from pre-existing observations or by performing an initial
approximate separation using, for example, singular value decomposition (see
Bouchet et al. (1997)). This information can then be used to construct an
approximate signal covariance matrix for use in  .
.
Substituting (9) and (10) into (5), the posterior probability is then given by
where  is given by (8). Completing the
square for
is given by (8). Completing the
square for  in the exponential (see Zaroubi (1995)), it is
straightforward to show that the posterior probability is also a multivariate
Gaussian of the form
in the exponential (see Zaroubi (1995)), it is
straightforward to show that the posterior probability is also a multivariate
Gaussian of the form
which has its maximum value at the estimate  of the signal
vector and where
of the signal
vector and where  is the covariance matrix of the reconstruction
errors.
is the covariance matrix of the reconstruction
errors.
The estimate  of the signal vector is found to be
where we have identified the Wiener matrix  . Thus, we find that
by assuming a Gaussian prior of the form (10) in Bayes' theorem, we
recover the standard Wiener filter. This optimal linear filter is usually
derived by choosing the elements of
. Thus, we find that
by assuming a Gaussian prior of the form (10) in Bayes' theorem, we
recover the standard Wiener filter. This optimal linear filter is usually
derived by choosing the elements of  such that they minimise the
variances of the resulting reconstruction errors. From (14) we see
that at a given Fourier mode, we may calculate the estimator
such that they minimise the
variances of the resulting reconstruction errors. From (14) we see
that at a given Fourier mode, we may calculate the estimator
 that maximises the posterior probability simply by
multiplying the data vector
that maximises the posterior probability simply by
multiplying the data vector  by the Wiener matrix
  .
Equation (14) can also be derived straightforwardly by
differentiating (12) with respect
.
Equation (14) can also be derived straightforwardly by
differentiating (12) with respect  and equating the
result to zero (see Appendix A).
and equating the
result to zero (see Appendix A).
As is well-known, the assignment of errors on the Wiener filter reconstruction
is straightforward and the covariance matrix of the reconstruction errors
 in (14) is given by
Since the posterior probability (13) is Gaussian, this matrix is
simply the inverse Hessian matrix of (minus) the exponent in (13),
evaluated at  (see Appendix A).
It should be noted that the linear nature of the Wiener filter and the simple propagation of errors are both direct consequences of assuming that the spatial templates we wish to reconstruct are well-described by Gaussian random fields with known covariance structure.
The emission due to several of the underlying physical processes may be far from Gaussian. This is particularly pronounced for kinetic and thermal SZ effects, but Galactic dust and free--free emissions also appear quite non-Gaussian. Ideally, one might like to assign priors for the various physical components by measuring empirically the probability distribution of temperature fluctuations from numerous realisations of each component. This is not feasible in practice, however, and instead we consider here the use of the entropic prior, which is based on information-theoretic considerations alone.
Let us consider a discretised image  consisting of
  cells, so that
 ; we may consider the
  as the components of an image vector
 . Using very general notions of subset independence, coordinate
invariance and system independence, it may be shown Skilling (1989) that the
prior probability assigned to the values of the components in this vector
should take the form
. Using very general notions of subset independence, coordinate
invariance and system independence, it may be shown Skilling (1989) that the
prior probability assigned to the values of the components in this vector
should take the form

where the dimensional constant  depends on the scaling of the problem
and may be considered as a regularising parameter, and
depends on the scaling of the problem
and may be considered as a regularising parameter, and  is a
model vector to which
is a
model vector to which  defaults in the absence of any data. The
function
defaults in the absence of any data. The
function  is the cross entropy of
 and
and  . In standard applications of the maximum
entropy method, the image
. In standard applications of the maximum
entropy method, the image  is taken to be a positive additive
distribution (PAD). Nevertheless, the MEM approach can be extended to images
that take both positive and negative values by considering them to be the
difference of two PADS, so that
is taken to be a positive additive
distribution (PAD). Nevertheless, the MEM approach can be extended to images
that take both positive and negative values by considering them to be the
difference of two PADS, so that

where  and
and  are the positive and negative parts of
 respectively. In this case, the cross entropy is given by
(Gull & Skilling (1990); Maisinger, Hobson & Lasenby (1997))
respectively. In this case, the cross entropy is given by
(Gull & Skilling (1990); Maisinger, Hobson & Lasenby (1997))
where  and
and  and
and
 are separate models for each PAD. The global maximum of the
cross entropy occurs at
are separate models for each PAD. The global maximum of the
cross entropy occurs at  .
.
In our application, we might initially suppose that at each Fourier mode we
should take the `image' to be the  components of the signal vector
 . However, this results in two additional complications. First,
the components of signal vector are, in general, complex, but the cross entropy
given in (16) is defined only if the image
. However, this results in two additional complications. First,
the components of signal vector are, in general, complex, but the cross entropy
given in (16) is defined only if the image  is real.
Nevertheless, the MEM technique can be straightforwardly extended to the
reconstruction of a complex image by making a slight modification to the above
discussion. If the image
is real.
Nevertheless, the MEM technique can be straightforwardly extended to the
reconstruction of a complex image by making a slight modification to the above
discussion. If the image  is complex, then models
  and
and  are also taken to be complex. In this case, the
real and imaginary parts of
are also taken to be complex. In this case, the
real and imaginary parts of  are the models for the positive
portions of the real and imaginary parts of
are the models for the positive
portions of the real and imaginary parts of  respectively.
Similarly, the real and imaginary parts of
respectively.
Similarly, the real and imaginary parts of  are the models for
the negative portions of the real and imaginary parts of the image. The total
cross entropy is then obtained by evaluating the sum (16) using first
the real parts and then the imaginary parts of
are the models for
the negative portions of the real and imaginary parts of the image. The total
cross entropy is then obtained by evaluating the sum (16) using first
the real parts and then the imaginary parts of  ,
,  and
and  , and adding the results. Thus the total cross
entropy for the complex image
, and adding the results. Thus the total cross
entropy for the complex image  is given by
where  and
and  denote the real and imaginary parts of each vector. For
simplicity we denote the sum (17) by
denote the real and imaginary parts of each vector. For
simplicity we denote the sum (17) by  where the subscript
  indicates that it is the entropy
of a complex image.
indicates that it is the entropy
of a complex image.
The second complication mentioned above is more subtle and results from the
fact that one of the fundamental axioms of the MEM is that it should not itself
introduce correlations between individual elements of the image. However, as
discussed in previous subsection, the elements of the signal vector
 at each Fourier mode may well be correlated, this correlation
being described by the signal covariance matrix
at each Fourier mode may well be correlated, this correlation
being described by the signal covariance matrix  defined in
(11). Moreover, if prior information is available concerning these
correlations, we would wish to include it in our analysis. We are therefore
lead to consider the introduction of an intrinsic correlation function (ICF)
into the MEM framework (Gull & Skilling (1990)).
defined in
(11). Moreover, if prior information is available concerning these
correlations, we would wish to include it in our analysis. We are therefore
lead to consider the introduction of an intrinsic correlation function (ICF)
into the MEM framework (Gull & Skilling (1990)).
The inclusion of an ICF is most easily achieved by assuming that, at each
Fourier mode, the `image' does not consist of the components of the signal
vector  , but that instead
  consists of the
components of a vector of hidden variables that are related to the signal
vector by
consists of the
components of a vector of hidden variables that are related to the signal
vector by
The  lower triangular matrix
  in (18)
is that obtained by performing a Cholesky decomposition of the signal
covariance matrix, i.e.
in (18)
is that obtained by performing a Cholesky decomposition of the signal
covariance matrix, i.e.  . We
note that since
. We
note that since  is real then so is
  . Thus, if the
components of
. Thus, if the
components of  are apriori uncorrelated (thereby satisfying the
MEM axiom) and of unit variance, so that
are apriori uncorrelated (thereby satisfying the
MEM axiom) and of unit variance, so that  , we find that, as required, the a priori covariance
structure of the signal vector is given by
, we find that, as required, the a priori covariance
structure of the signal vector is given by

Moreover, using this construction the expected rms level for the real or
imaginary part of each element of  is simply equal to
 . Therefore, at each Fourier mode, we assign the real and imaginary
parts of every component in the model vectors
. Therefore, at each Fourier mode, we assign the real and imaginary
parts of every component in the model vectors  and
and  to be equal to
  .
.
Substituting (18) into (8),  can also be written
in terms of
can also be written
in terms of  and is given by
Thus, using an entropic prior, the posterior probability becomes
where the cross entropy  is
given by (17) and (16).
is
given by (17) and (16).
As discussed in Section 2.1, we choose our estimate
 of the signal vector at each Fourier mode, as that which
maximises the posterior probability
of the signal vector at each Fourier mode, as that which
maximises the posterior probability  with
respect to
with
respect to  .
.
For the Gaussian prior, we found in Section 2.2 that the posterior
probability is also a Gaussian and that the estimate  is
given directly by the linear relation (14). Nevertheless, we also
note that, in terms of
is
given directly by the linear relation (14). Nevertheless, we also
note that, in terms of  defined in (18), the quadratic
form in the exponent of the Gaussian prior (10) has the particularly
simple form
defined in (18), the quadratic
form in the exponent of the Gaussian prior (10) has the particularly
simple form

i.e. it is equal the inner product of  with itself. Thus, using a
Gaussian prior, the posterior probability can be written in terms of
with itself. Thus, using a
Gaussian prior, the posterior probability can be written in terms of
 as
as
where  is given by (19) Therefore, in
addition to using the linear relation (14), the Wiener filter
estimate
is given by (19) Therefore, in
addition to using the linear relation (14), the Wiener filter
estimate  can also be found by first minimising the
function
can also be found by first minimising the
function
to obtain the estimate  of the corresponding hidden vector,
and then using (18) to give
of the corresponding hidden vector,
and then using (18) to give  .
.
We have developed an algorithm (which will be presented in a forthcoming paper)
for minimising the function  with respect to
  .
Indeed, this algorithm calculates the reconstruction
.
Indeed, this algorithm calculates the reconstruction  in
slightly less CPU time than the matrix inversions and multiplications required
to evaluate the linear relation (14). The minimiser requires only
the first derivatives of the function and these are given in Appendix A.
in
slightly less CPU time than the matrix inversions and multiplications required
to evaluate the linear relation (14). The minimiser requires only
the first derivatives of the function and these are given in Appendix A.
Let us now consider the MEM solution. From (20), we see that maximising the posterior probability when assuming an entropic prior is equivalent to minimising the function
The minimisation of this  -dimensional functions may also performed using
the minimisation algorithm mentioned above, and the required first derivatives
in this case are also given in Appendix A.
-dimensional functions may also performed using
the minimisation algorithm mentioned above, and the required first derivatives
in this case are also given in Appendix A.
It is important to note that, since we are using the same minimiser to obtain
both the Wiener filter (WF) and MEM reconstructions, and the evaluation of each
function and its derivatives requires similar amounts of computation, the two
methods require approximately the same CPU time. Thus, at least in this
application, any criticism of MEM that is based on its greater computational
complexity, as compared to the WF, is no longer valid. For both the WF and the
MEM, the reconstruction of the six  maps of the input components
requires only about two minutes on a Sparc Ultra workstation.
maps of the input components
requires only about two minutes on a Sparc Ultra workstation.
Despite the formal differences between (22) and (23), the
WF and MEM approaches are closely related. Indeed the WF can be viewed as a
quadratic approximation to MEM, and is commonly referred to as such in the
literature. This approximation is most easily verified by considering the small
fluctuation limit, in which the real and imaginary parts of  are
small compared to the corresponding models.
are
small compared to the corresponding models.
Following the discussion at the end of Section 2.3, we begin by
setting the real and imaginary parts of all the components of the models
vectors  and
and  equal to
  . Then, expanding
the sum in (16) as a power series in
. Then, expanding
the sum in (16) as a power series in  and using (17),
we find that for small
and using (17),
we find that for small  the total cross entropy is approximated by
Thus, in the small fluctuation limit, the posterior probability assuming an entropic prior becomes Gaussian and is given
In fact, this approximation is reasonably accurate provided the magnitudes of
the real and imaginary parts of each element of  are less than
about
are less than
about  . Since
  is set equal to the expected rms of level these
parameters, we would therefore expect that for a Gaussian process this
approximation should remain valid. In this case, the posterior probability
(25) becomes identical to that for the WF solution, provided we set
is set equal to the expected rms of level these
parameters, we would therefore expect that for a Gaussian process this
approximation should remain valid. In this case, the posterior probability
(25) becomes identical to that for the WF solution, provided we set
 .
.
We note, however, that for highly non-Gaussian processes, the magnitudes of the
real and imaginary parts of the elements of  can easily exceed
 and in this case the shapes of the posterior probability for the WF and
MEM approaches become increasingly different.
and in this case the shapes of the posterior probability for the WF and
MEM approaches become increasingly different.

A common criticism of MEM has been the arbitrary choice of regularisation
constant  , which is often considered merely as a Lagrange multiplier.
In early applications of MEM,
, which is often considered merely as a Lagrange multiplier.
In early applications of MEM,  was chosen so that the misfit statistic
 equalled its expectation value, i.e. the number of data points to be
fitted. This choice is usually referred to as historic MEM.
equalled its expectation value, i.e. the number of data points to be
fitted. This choice is usually referred to as historic MEM.
In the reconstruction of Fourier modes presented here, the situation is eased
somewhat since the choice  is at least guaranteed to reproduce the
results of the Wiener filter when applied to Gaussian processes. In fact, when
applied to the simulations presented in the companion paper, this choice of
is at least guaranteed to reproduce the
results of the Wiener filter when applied to Gaussian processes. In fact, when
applied to the simulations presented in the companion paper, this choice of
 does indeed bring
  into its expected statistical range
 , where
  is the number of (complex) values in the data
vector
is the number of (complex) values in the data
vector  at each Fourier mode.
Nevertheless, it is possible to determine the appropriate value for  in
a fully Bayesian manner (Skilling (1989); Gull & Skilling (1990)) by simply treating
it as another parameter in our hypothesis space. It may be shown (see Appendix
B) that
in
a fully Bayesian manner (Skilling (1989); Gull & Skilling (1990)) by simply treating
it as another parameter in our hypothesis space. It may be shown (see Appendix
B) that  must be a solution of
where  is the hidden vector that maximises the posterior
probability for this value of
is the hidden vector that maximises the posterior
probability for this value of  . The
. The  matrix
  is given by

where  is the Hessian matrix of the function
 at the point
  and
and  is the
metric on image-space at this point.
is the
metric on image-space at this point.
It should be noted that both the reconstruction  and the
matrix
and the
matrix  depend on
  and so (26) must be solved
numerically using an iterative technique such as linear interpolation or the
Newton--Raphson method. We take
and so (26) must be solved
numerically using an iterative technique such as linear interpolation or the
Newton--Raphson method. We take  as our initial estimate in order to
coincide with the Wiener filter in the small fluctuation limit. For any
particular value of
as our initial estimate in order to
coincide with the Wiener filter in the small fluctuation limit. For any
particular value of  , the corresponding reconstruction
  is obtained by minimising
  as given in
(23), and the Hessian of the posterior probability at this point is
then calculated (see Appendix A). This in turn allows the evaluation of
as given in
(23), and the Hessian of the posterior probability at this point is
then calculated (see Appendix A). This in turn allows the evaluation of
 and
and  respectively. Typically, fewer than ten iterations are
needed in order to converge on a solution
respectively. Typically, fewer than ten iterations are
needed in order to converge on a solution  that satisfies
(26).
that satisfies
(26).
In the MEM approach, after the Bayesian value  for the
regularisation constant has been found, the corresponding posterior probability
distribution is maximised to obtain the reconstruction
for the
regularisation constant has been found, the corresponding posterior probability
distribution is maximised to obtain the reconstruction  , from which the estimate of the signal vector
  may be straightforwardly derived. Once this has been performed for each
Fourier mode, the reconstruction of the sky emission due to each physical
component is then found by performing an inverse Fourier transform.
may be straightforwardly derived. Once this has been performed for each
Fourier mode, the reconstruction of the sky emission due to each physical
component is then found by performing an inverse Fourier transform.
We could, of course, end our analysis at this point and use the maps obtained
as our final reconstructions. However, we find that the results can be further
improved by using the current reconstruction to update the ICF matrix
 and the models
  and
and  , and then
repeating the entire MEM analysis discussed above. At each Fourier mode, the
updated models are taken directly from the current reconstruction and the
updated ICF matrix is obtained by calculating a new signal covariance matrix
, and then
repeating the entire MEM analysis discussed above. At each Fourier mode, the
updated models are taken directly from the current reconstruction and the
updated ICF matrix is obtained by calculating a new signal covariance matrix
 from the current reconstruction and performing a Cholesky
decomposition. These quantities are then used in the next iteration of the MEM
and the process is repeated until it converges on a final reconstruction.
Usually, fewer than ten such iterations are required in order to achieve
convergence.
from the current reconstruction and performing a Cholesky
decomposition. These quantities are then used in the next iteration of the MEM
and the process is repeated until it converges on a final reconstruction.
Usually, fewer than ten such iterations are required in order to achieve
convergence.
We might expect that a similar method may be used in the WF case, by repeatedly calculating an updated signal covariance matrix from the current reconstruction and using it in the subsequent iteration of the WF analysis. It is well-known, however, that, since the WF tends to suppress power at higher Fourier modes, the solution gradually tends to zero as more iterations are performed. This behaviour was indeed confirmed by experiment.
Once the final reconstruction has been obtained, it is important to be able to
characterise the errors associated with it. In the case of the Wiener filter,
the reconstructed signal vector  at each Fourier mode may be
obtained in a linear manner from the observed data vector using
(14). Thus the propagation of errors is straightforward and the
covariance matrix of the reconstruction errors at each Fourier mode is given by
(15).
at each Fourier mode may be
obtained in a linear manner from the observed data vector using
(14). Thus the propagation of errors is straightforward and the
covariance matrix of the reconstruction errors at each Fourier mode is given by
(15).
As mentioned in Section 2.2, however, this simple propagation of
errors is entirely a result of the assumption of a Gaussian prior, which,
together with the assumption of Gaussian noise, leads to a Gaussian posterior
probability distribution. In terms of the vector of hidden variables
 the posterior probability for the WF is given by

where the Hessian matrix  is given by
  evaluated at the peak
  of the distribution, and the function
 is given by (22). Thus, the covariance matrix of the
errors on the reconstructed hidden vector is then given exactly by the
inverse of this matrix, i.e
is given by (22). Thus, the covariance matrix of the
errors on the reconstructed hidden vector is then given exactly by the
inverse of this matrix, i.e

From (18), the error covariance matrix for the reconstructed signal vector is then given by
Using the expression for the Hessian matrix given in (35), and
remembering that  and
and  , the expression (27) is easily shown to be
identical to the result (15).
, the expression (27) is easily shown to be
identical to the result (15).
For the entropic prior, the posterior probability distribution is not strictly
Gaussian in shape. Nevertheless, we may still approximate the shape of this
distribution by a Gaussian at its maximum and, recalling the discussion of
subsection 2.5, we might expect this approximation to be reasonably
accurate, particularly in the reconstruction of Gaussian processes. Thus, near
the point  , we make the approximation

where  evaluated at
  , and
, and  is
given by (23). The covariance matrix of the errors on the
reconstructed hidden vector is then given approximately by the inverse of
this matrix, and so
is
given by (23). The covariance matrix of the errors on the
reconstructed hidden vector is then given approximately by the inverse of
this matrix, and so

In both the WF and MEM cases, the reconstructed maps of the sky emission due to each physical component is obtained by inverse Fourier transformation of the signal vectors at each Fourier mode. Since this operation is linear, the errors on these maps may therefore be deduced straightforwardly from the above error covariance matrices.