| Toco CMB Anisotropy Experiment | PrincetonCMB |
· Instrument
» Site
· Analysis
· Results
· Internal
Chilean Atmospheric Opacities
The following plots summarize the opacities measured at 225 GHz by the NRAO tipper. Click on the figures to download a postscript version.
At 225 GHz, most of the opacity comes from precipitable water vapor, according to the opacity spectrum of the atmosphere. This water vapor also is the variable component, so opacities may serve as a useful component of assessing atmosperic stability. Other indicators are derived from the phase stability monitoring that NRAO has made.
- monthly opacities at the proposed MMA site in Chile
- monthly opacities at Mauna Kea
- comparison of Chile and Mauna Kea, over various periods

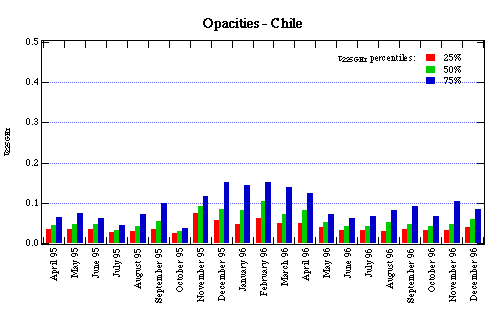
This plot shows the monthly average opacities for the Chilean
site, with the 25%, 50%, and 75% percentiles shown separately.
November through April are between a factor of 2 and 3 worse
than the winter months in terms of total opacity.

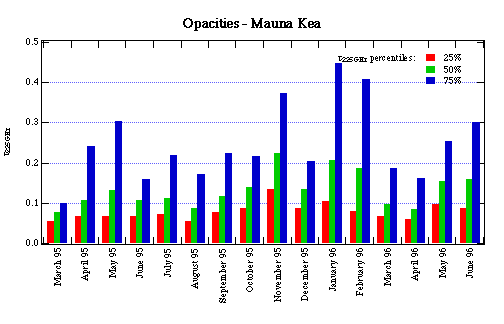
This is exactly the same plot for Mauna Kea, using the same type
of 225 GHz tipper. Mauna Kea's altitude is about 2000 ft less
than that of the Chilean site. The vertical axes are the same
as above. Note the overall worse opacities and the strong
variability, both from month to month and from one quartile to
another.

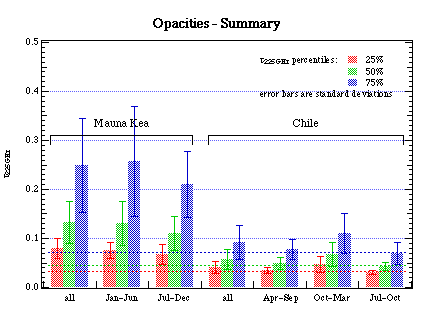
This plot summarizes the two plots above, where the individual
months have been averaged (percentile by percentile). The error
bar is the standard deviation of the values from month to month,
and can serve as an indication of the "reliability" of the
conditions.