Main
· Science
· Instrument
· Backend
· Channelizer
· Design
· Enclosure
· Fabrication
» Performance
· Future Revisions
· Correlator
· Receiver
· Optics
· Data Acquisition
· Local Oscillator
· Base
· Site
· Analysis
· Results
· Publications
· Team
There are a number of performance criteria to focus on in evaluating the performance of the channelizer. The first one we chose to focus on is the location of the band edges. We first measured the band edges with the mixers out. this was possible with the first version of the channelizer which had the option of feeding the bandpass filters directly to the output. Since there were no mixers, there was no frequency conversion. This meant that we could use a Vector Network Analyzer to carefully measure the S-parameters of all of the bands.
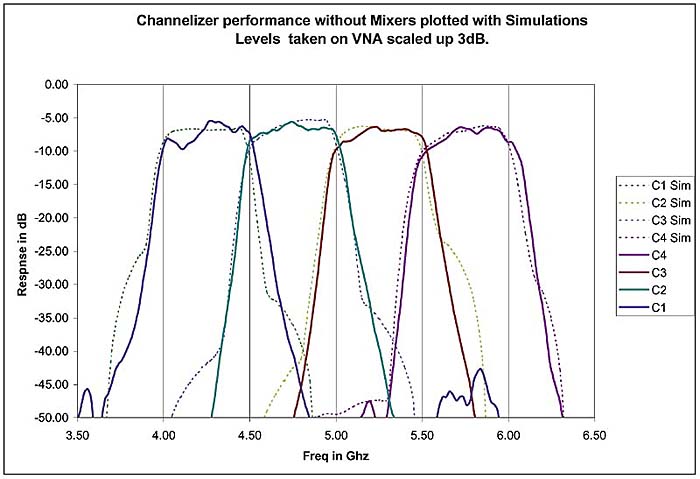
fig. 1 The VNA measured Transmission of the bands are plotted on top of the dotted Momentum/linear simulations.
pdf
In figure 1 we show the transmission of the filters plotted on top of the simulations. The band edges agree very well. The flatness of the bandpasses are of some concern, but since we are using a 16-lag correlator, we will be able to correct to some degree for band flatness in software on the scale of 1/8th of the band, or 62.5 MHz. The suppression of the filters is about 40 dB at worse far from the bandpass, and 70dB in some cases. This is also very similar to the simulations. The data are also 3dB off from zero loss, a factor that is close to what is expected from the loss of the material and the connectors.
The story is slightly different when we include the mixers. Firstly, it is slightly1 harder to measure bandpasses when there is frequency conversion. The input and the output are at different frequencies, so it's meaningless to talk about the S matrix, and VNA's cannot measure the bandpass. We measured the bandpass by using sweeper to sweep through 4-6 Ghz, then we measured the level at the output with a spectrum analyzer. This allowed us to sort out all of the 3rd and higher order nonlinearities from the signal we were concerned with. This of course, is not how the channelizer will finally work, but it allowed for a more accurate determination of the bandpass.
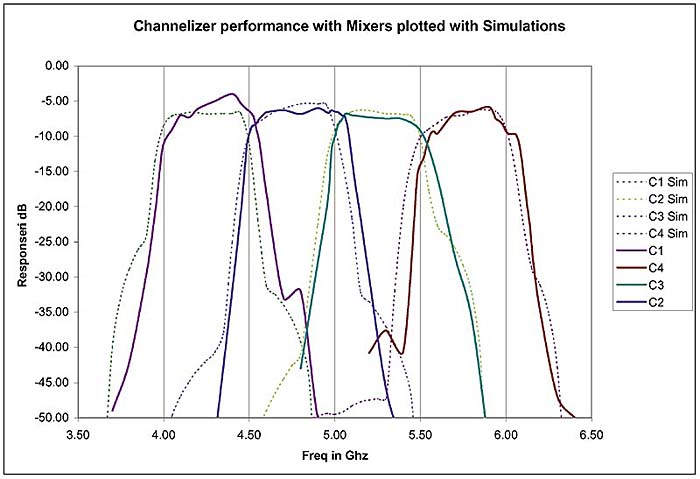
fig. 2 Bandpasses with mixers.
pdf
excel 2000 file
The band is slightly degraded when the mixers are inserted. This most likely reason is because the input impedance of the mixers in not 50 Ohms or all real. The mismatch would effect the bandpass of the filters. For a possible fix, see Future Revisions
Phase
The other important figure of merit for anything having to do with an interferometer the the phase error introduced by any of the components. Obviously, the only thing that matters is the relative phase match and stability between different elements. The way we tested the phase was different from the way we tested the bandpasses. We injected noise at the front end by the use of a noise noise source with ~25dB ENR and amplified it with a miteq amplifier. The signal was split with an Anaren 4-8 GHz splitter then into two line-stretchers and fed into the two separate banks of the channelizer. At the output, we selected identical bands and fed them into two separate ports of a 2GHz digital Oscilloscope. 2us of data were captured and then transfered to a computer for a 128-lag cross-correlation. An FFT of the cross Correlation should give the relative phase. It is interesting to note that this technique could also give the bandpasses. The only problem is that the sensitivity is limited by the quantization noise, which at 8-bits sets the noise floor at about -20dB.
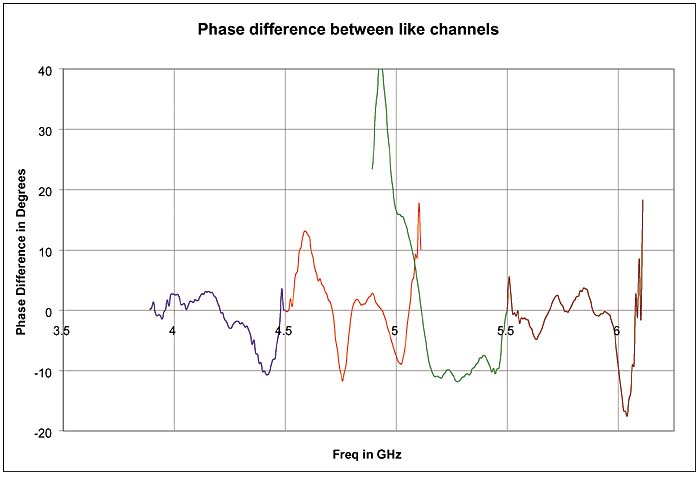
fig. 2 Phase comparison between bands.
pdf
excel 2000 file
The phase difference is about 10 degrees for signals within the band. There is sufficient signal to noise outside of the cutoff in each filter to see the effects of the fast phase-wrapping at the band edges. Note that the limitation of this technique is that there is a zero frequency in the output where it is impossible to measure the phase. Any negative frequencies get wrapped around zero. If it becomes important to measure the phase at both cutoff frequencies, it can be accomplished by moving the LO frequencies slightly away from the band edges.
We should also note that we used to line stretchers to remove ~10 degree slope. Doing this means that we have no absolute measurement of time-delay between channelizers. It also not clear if this time/length difference comes primarily form the channelizer or the splitter and cables that feed the channelizer.
Even though the phase differences are small, because MINT has a digital correlator it has the capability to remove stable phase differences. The limitation to phase correction depends on the resolution of the correlator. The MINT correlator has 16 lags, which translates to 8 frequency bins per band. Phase errors that are slow on this scale will be removed.